
Data Analysis and Management
Support services data, turned into decisions leaders can defend.
Most support services data lives in separate places: a request platform here, an audit log there, labor reports in finance, and spreadsheets on a manager's desktop. Each one tells part of the story. Our analytics team brings those sources together, checks them for accuracy, and builds reporting around the questions hospital leaders actually ask. Where is labor going? Which units are driving demand? Where are we exposed, before the survey?
Because HealthOps also runs the programs, our analysts work alongside operations managers who know what the numbers mean on the floor. Data from our own platforms, including WeGotIt, STIC, and Atlas, sits alongside your HR, finance, and operational systems, so every recommendation is grounded in how the work actually gets done.
Executives get one trusted view of performance.
Managers get clear priorities.
Finance gets the evidence to fund what works and cut what doesn't.

HealthOps Data Analytics collects, cleans, and connects operational data from equipment, transport, sharps, EVS, labor, and compliance systems, then turns it into dashboards and recommendations your teams can act on. At one New England hospital, this approach helped lift EVS compliance scores from 68% to 83% in six months.
Measured Gains
68% to 83%
EVS compliance in six months at a New England hospital
$1.5M
Annual transport cost reduction identified by a HealthOps labor model
45 to 65
Items cleaned per day after data informed scheduling
22 to 12 min
Average cleaning time per device

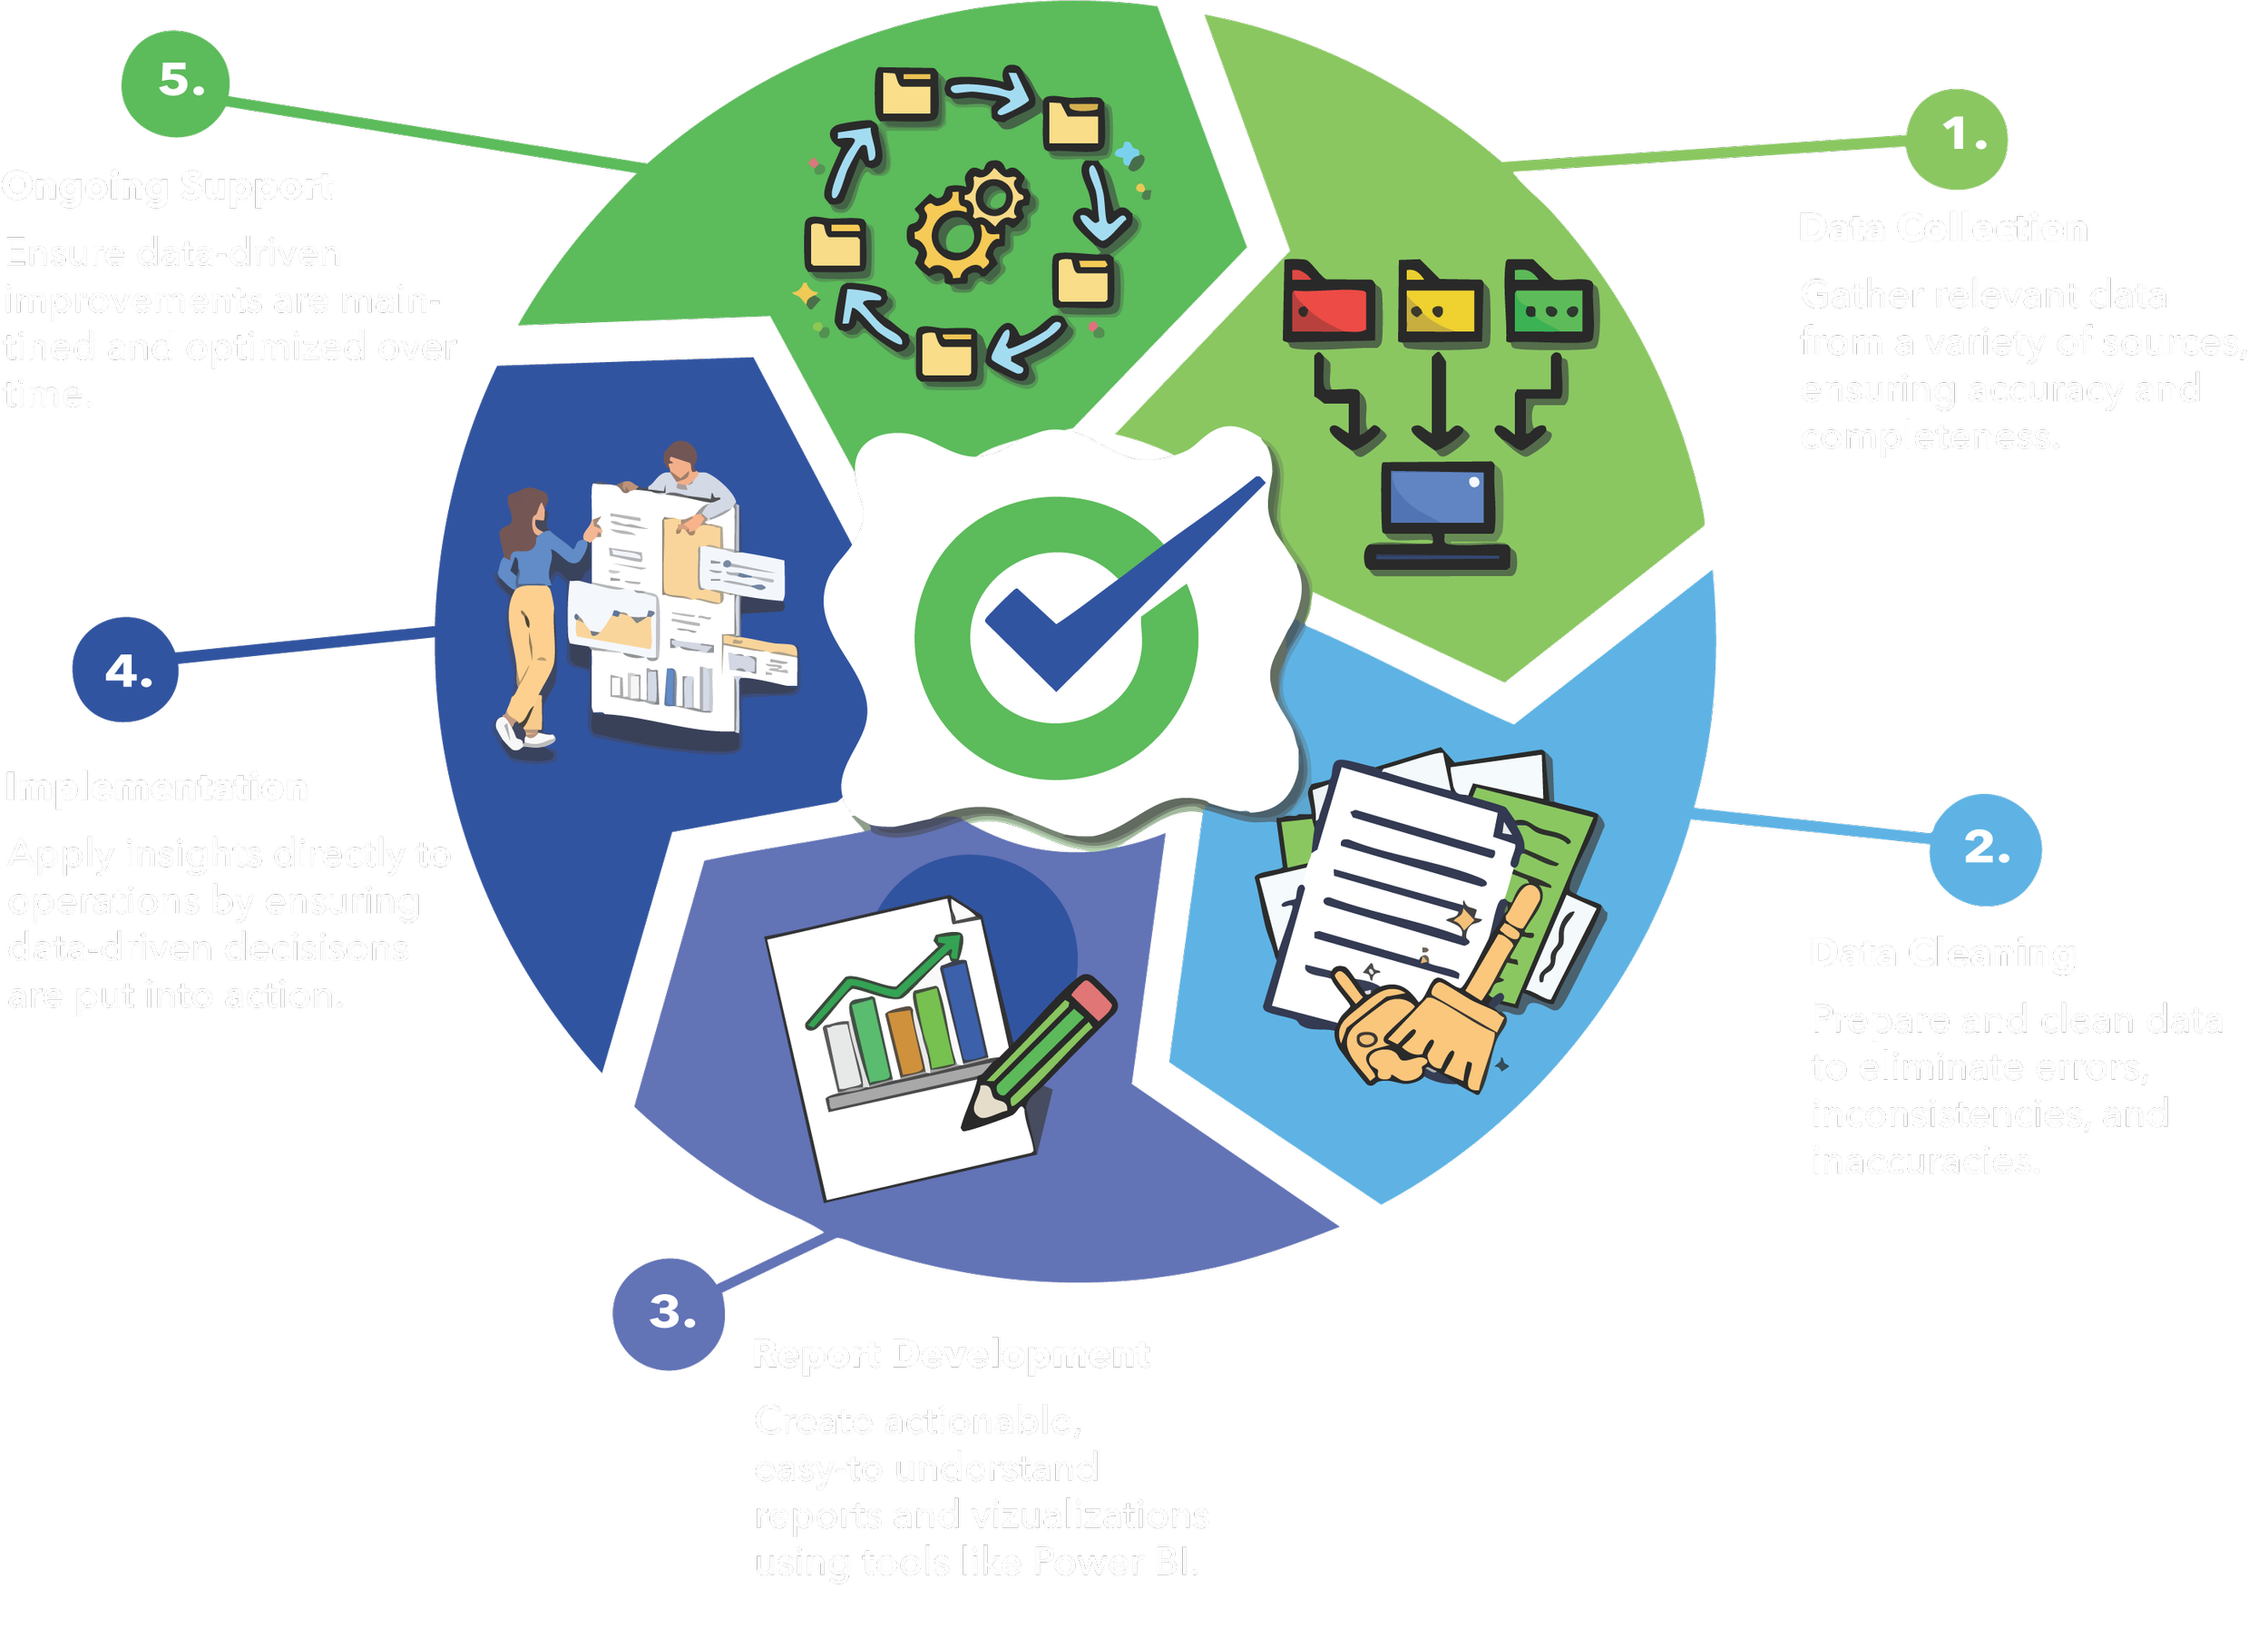
Data Cycle
Data Collection: We capture data from every relevant source, including labor, cleaning schedules, equipment requests, sharps exchanges, Cross-Checks results, vendor productivity, and compliance logs.
Data Cleaning: We remove errors, duplicates, and inconsistencies so leaders can trust what they see.
Report Development: We build dashboards and reports in Power BI, Python, or the tools your team already uses, designed around your goals and KPIs.
Implementation: We work with your managers to turn trends into changes in staffing, scheduling, and workflow.
Ongoing Support: We track results, refine reporting as needs change, and share outcomes with stakeholders at the level of support you choose.
How it Works
Data Cycle
What the program delivers
One view across services: Equipment, transport, sharps, EVS, and compliance data in a single reporting structure, instead of separate reports from separate vendors.
Labor and staffing models: Demand and productivity data show where staff are needed by hour, shift, and unit, and where labor cost can come down without hurting service.
Survey readiness: Audit results, cleaning records, and documentation trends give quality and compliance leaders evidence to review before The Joint Commission arrives.
Vendor accountability: Productivity and service level data show whether contracted services are delivering what you're paying for.
Data strategy and expertise: For organizations without a full time CDO, our team provides data strategy, governance, and analytics leadership without adding headcount.
Tools that fit: We work in Power BI, Python, and your existing platforms, so reports fit the way your organization already works.
Send us a sample of your current reports or data exports. We'll show you what they reveal about labor, turnaround, and compliance, and where the gaps are.
Analytics with operators behind it
Plenty of firms can build a dashboard. Fewer have run the services the dashboard measures. HealthOps analytics is led by a team with more than a decade of hospital operations and analytics experience, and it is built into every program we manage, from Equipment Management and Patient Transport to Sharps Management, Deep Clean, and EVS Cross-Checks. The recommendations you receive are ones we know how to carry out.
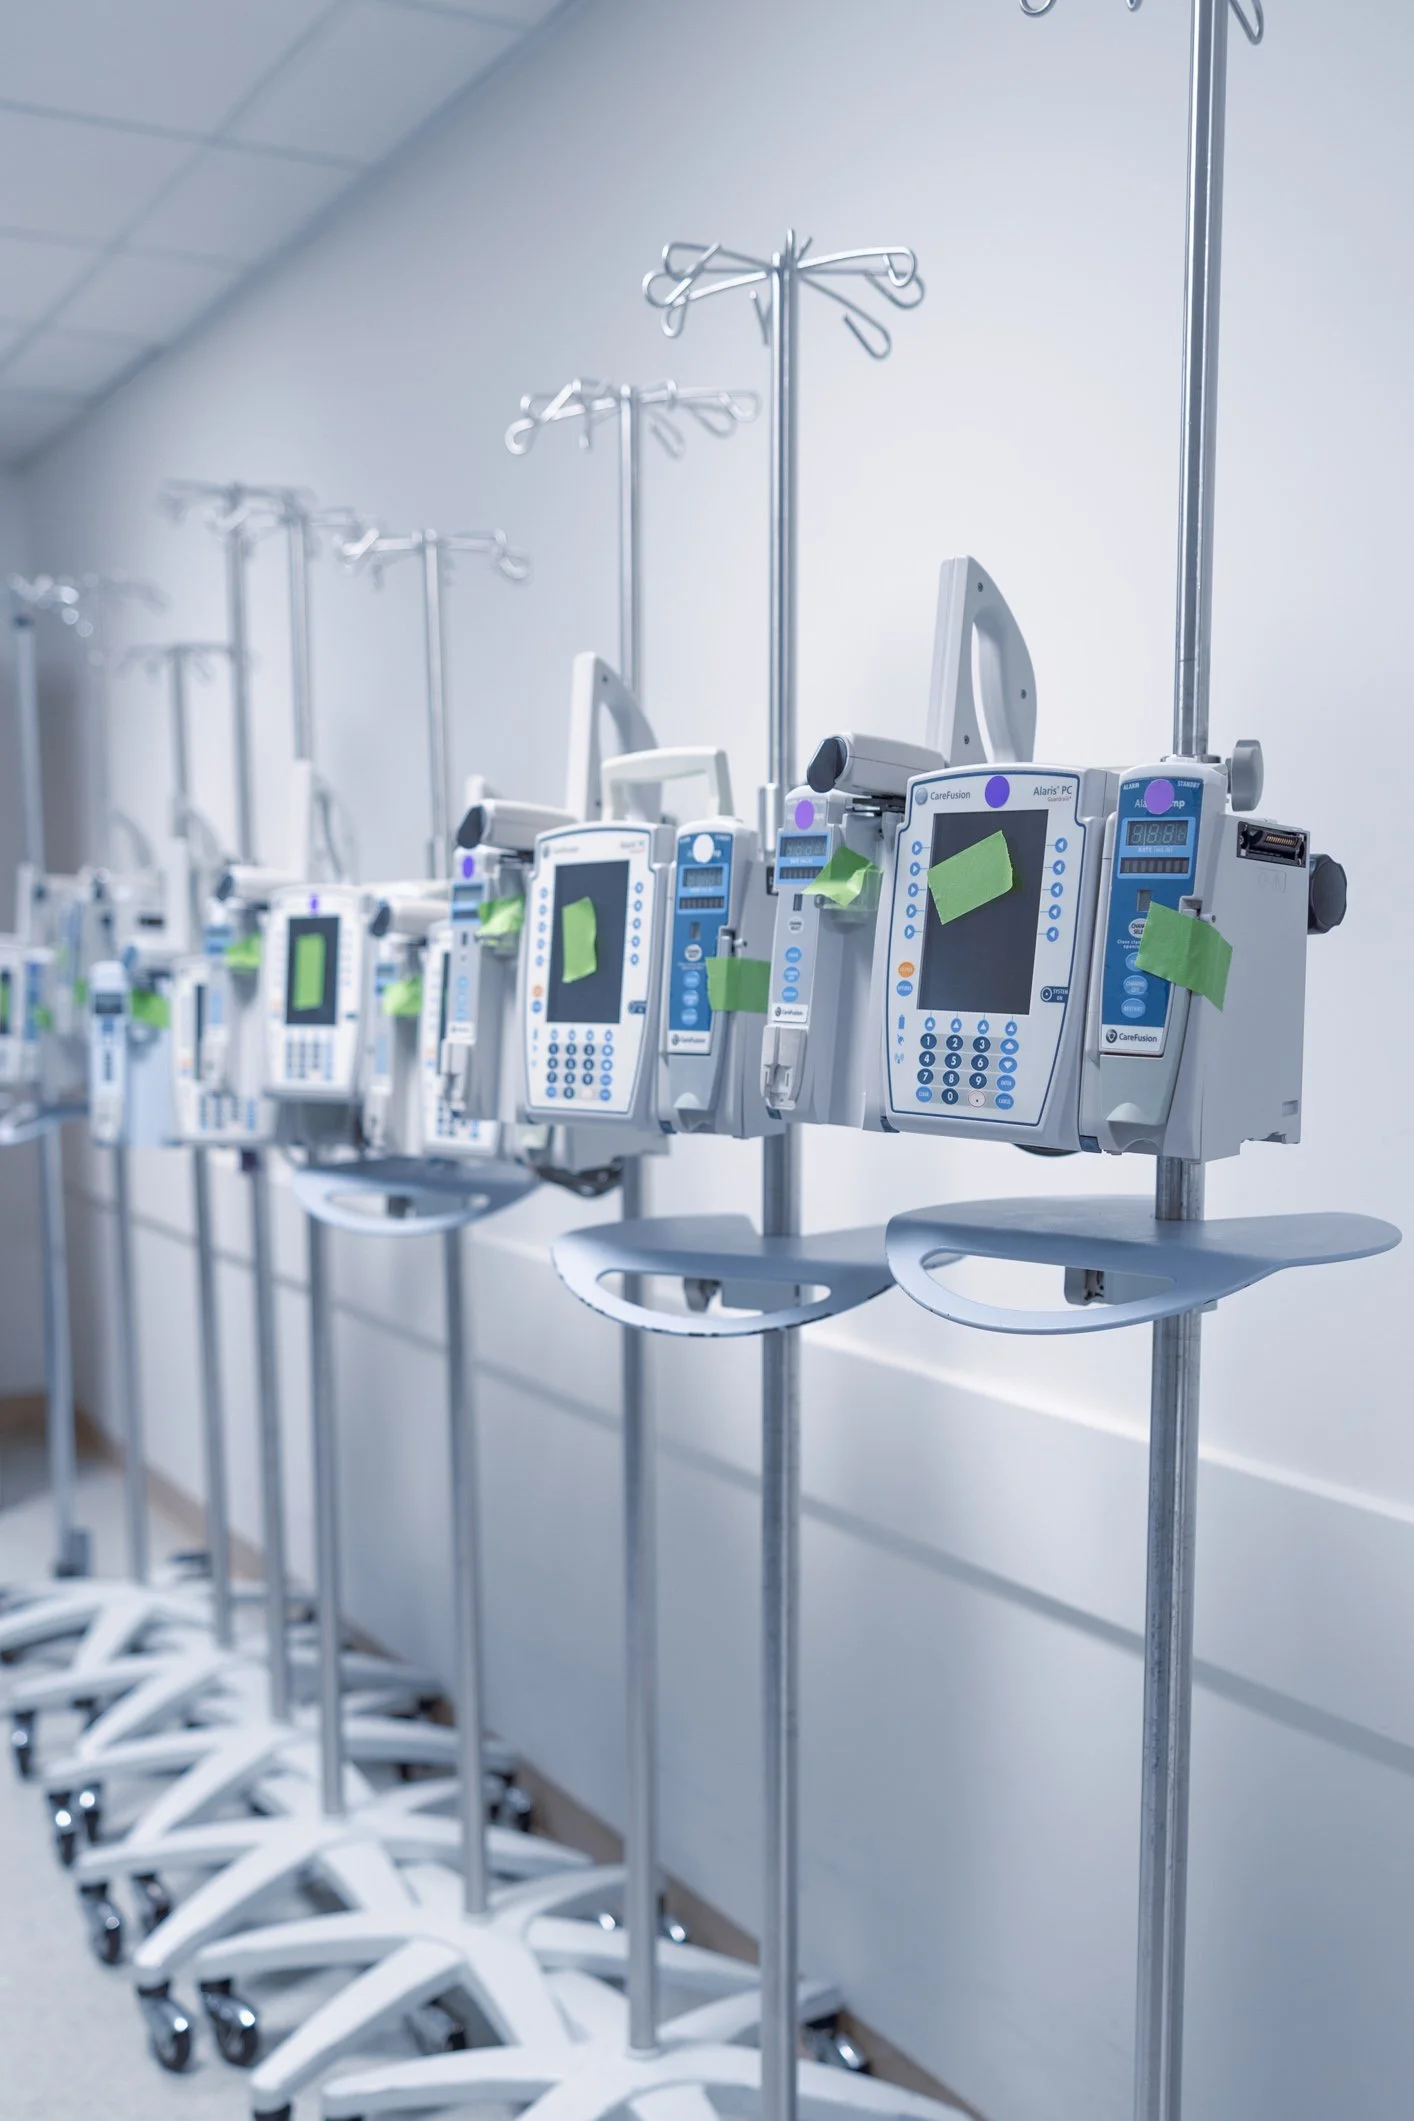
EVS cleaning compliance is usually self-reported. At one New England hospital, HealthOps added an independent, data-based layer of validation: digital records of cleaning effectiveness by time, unit, and category, reviewed in regular meetings with EVS leadership. Compliance climbed from 68% to 83% in six months, and outdated procedures and service level agreements were updated to align with current Joint Commission standards.
Case Study: HealthOps Cross-Checks Program, Elevating Standards at a New England Hospital
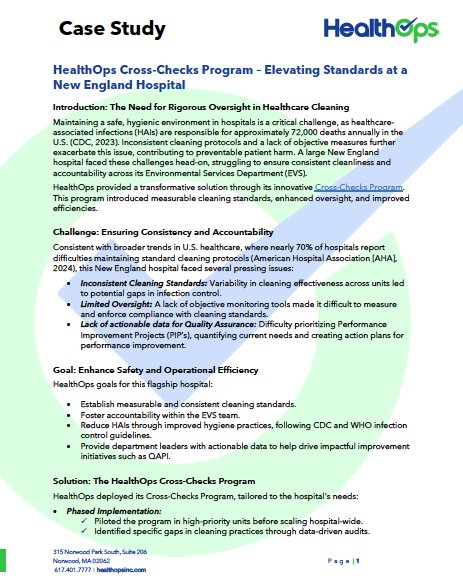
CROSS CHECKS AND BALANCES: CASE STUDY
Internal audits can miss what matters most, leaving infection control, compliance, and accountability vulnerable. At a Boston hospital, leaders turned to HealthOps for independent Cross-Checks, gaining rigorous oversight, actionable insights, and measurable improvements in audit scores. Find out why third-party eyes made all the difference.